
Migrating from Scanpy#
Cellestial replaces scanpy.pl with Lets-Plot-based plotting functions
that return composable plot objects.
Key Differences#
A handful of mental shifts cover most of the migration:
Functions return plot objects.
cl.umap(...)returns a Lets-PlotPlotSpec. Add titles, themes, scales and extra layers with+. The function returns the plot; display or save it explicitly as needed.One color slot is named
key, notcolor. Thekeycan be either a metadata column (cluster, cell type) or a gene name; Cellestial picks the right scale automatically.Multiple panels use the plural form. Where
sc.pl.umapaccepts a list of colors and tiles the result, Cellestial exposes a separatecl.umaps(andcl.tsnes,cl.pcas,cl.violins, …).Snake case parameters.
groupbybecomesgroup_by,var_namesbecomeskeys.Saving is a separate call. Use
cl.save(plot, "umap.png")instead of passingsave=to the plotting function.Interactivity is on by default. Tooltips, zoom and pan ship with every plot through the Lets-Plot toolbar.
Function Reference#
Scanpy |
Cellestial |
Notes |
|---|---|---|
|
|
|
|
|
|
|
|
|
|
|
Pass the embedding name through |
|
|
Takes a Lets-Plot |
|
|
|
|
|
Built-in dendrogram via |
|
|
|
|
|
|
|
|
|
|
|
|
|
|
|
|
|
Use |
Worked Examples#
UMAP by cluster#
sc.pl.umap(
adata,
color="leiden",
legend_loc="on data",
)
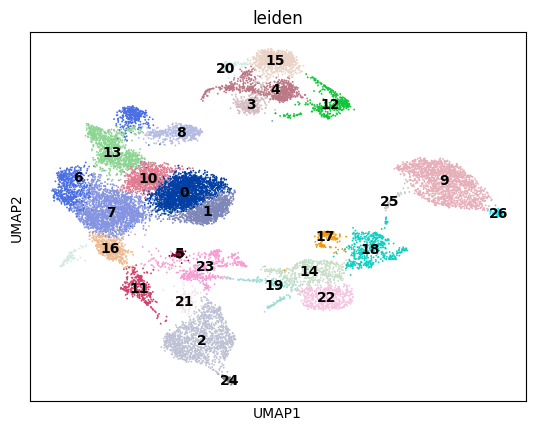
cl.umap(
data,
key="leiden",
legend_ondata=True,
) + scale_color_hue()

UMAP by gene, multi-panel#
sc.pl.umap(
adata,
color=["MS4A1", "CD3D", "NKG7"],
)
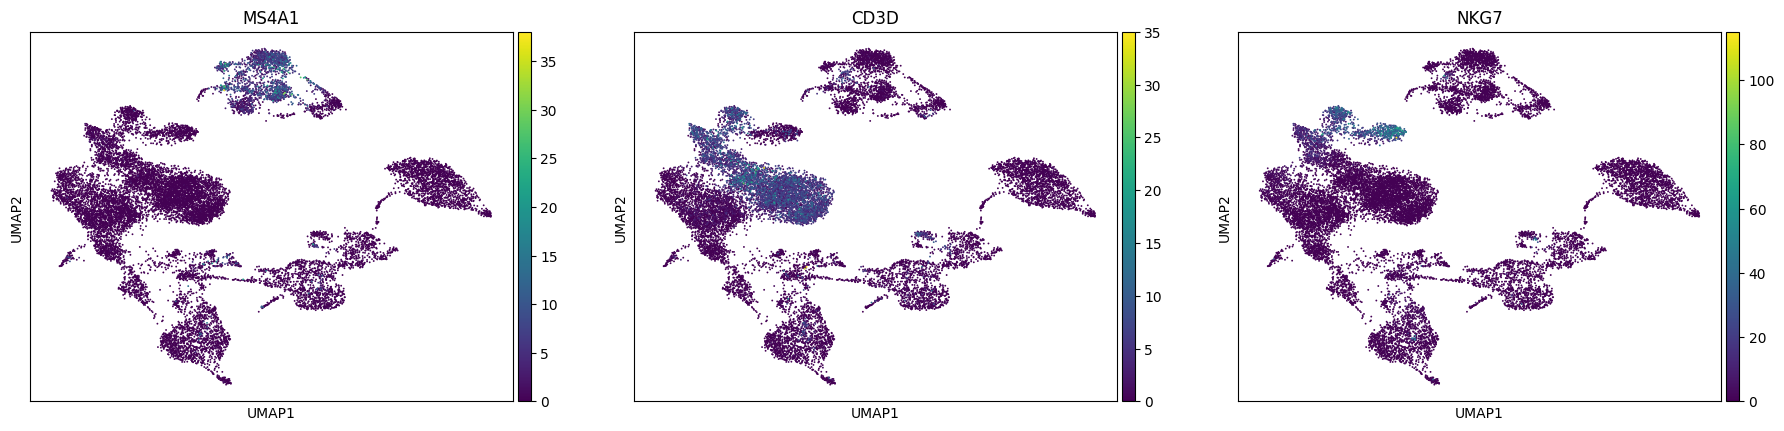
cl.umaps(
data,
keys=["MS4A1", "CD3D", "NKG7"],
)

Dotplot of marker genes#
sc.pl.dotplot(
adata,
var_names=markers,
groupby="cell_type_lvl1",
dendrogram=True,
)
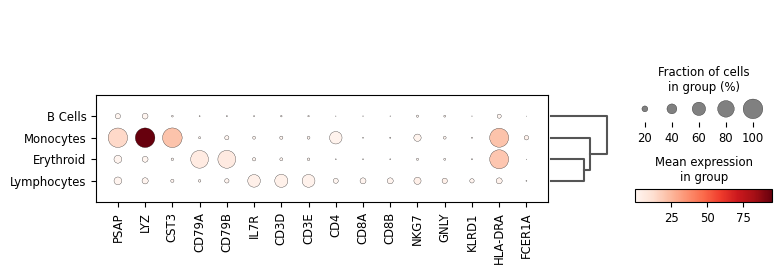
cl.dotplot(
data,
keys=markers,
group_by="cell_type_lvl1",
dendrogram=True,
)

Violin per group#
sc.pl.violin(
adata,
keys="CD3D",
groupby="cell_type_lvl1",
)
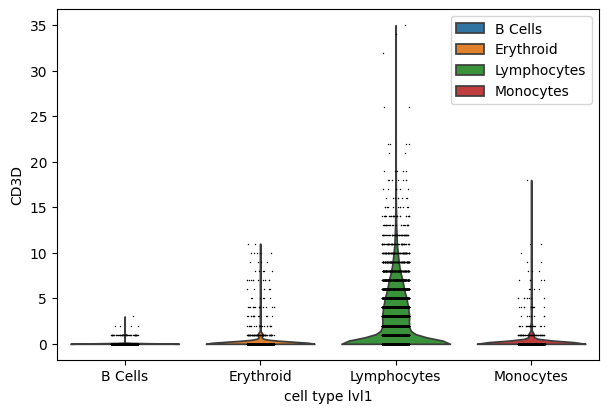
cl.violin(
data,
key="CD3D",
fill="cell_type_lvl1",
) + scale_fill_hue()

Cellestial adds significance brackets through a separate layer, which has no direct equivalent in scanpy:
(
cl.violin(data, key="CD3D", fill="cell_type_lvl1", threshold=0.1)
+ scale_fill_hue()
+ cl.bracket(
y_padding=0.2,
label="pvalue",
prefix="p",
prefix_style="<",
comparisons=[
("Lymphocytes", "Monocytes"),
("Monocytes", "B Cells"),
],
)
)

Spatial overlay#
sc.pl.spatial(
spatial_adata,
color="clusters",
)
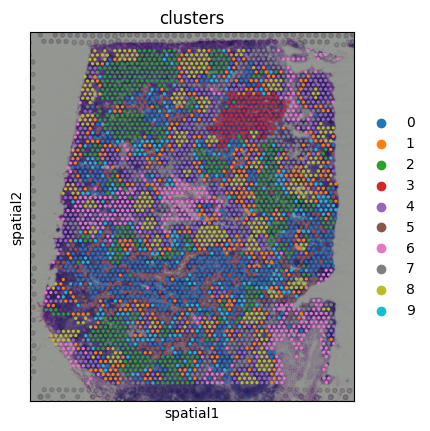
cl.spatial(
spatial_data,
key="clusters",
)

Saving plots#
sc.pl.umap(
adata,
color="leiden",
save="_leiden.png",
)
plot = cl.umap(data, key="leiden")
cl.save(plot, "umap_leiden.png")
Missing Scanpy Plot Mappings#
A few scanpy plotting helpers do not have a one-to-one replacement yet:
sc.pl.tracksplotsc.pl.embedding_densitysc.pl.pagaand other trajectory-specific helpers
Where To Next#
Quickstart for a guided tour of the API.
API Reference for the full function reference.
Features for a deeper look at each plot family.